PortugalFuel prices in ’ have fallen by 12 cents per liter since Monday

PortugalFuel prices in ’, the National Association of Fuel Retailers, predicts that ’ (Anarec) will be lower starting next Monday. 12 cents per liter discount on gasoline and engine.

Starting Monday, the average price of 95-octane unleaded gasoline will be 1,904 euros per liter, while the price of standard diesel will be 1,837 euros per liter, the association said in a statement to news outlets.

However, these prices are not final; A fall in prices could lead the government to reduce tax cuts on petroleum productsThis led to a cut slightly smaller than the initial estimate of 12 cents. Despite this, the decline is expected to be double-digit.

The uncertainty created by the conflicts in the Middle East’ and the blockade of the Strait of Hormuz, one of the main ways of transporting oil, led to sharp increases in the price per barrel, which also pushed fuel prices up. This Friday, a barrel of Brent crude oil, the benchmark of the European market, was trading. the Daily Journal %A little over $91, down 1.5. Despite the declines in the past month, the price per barrel is still higher than at the beginning of the year. %It's higher than 44.

Europe’ household energy prices rose after the Iran war: Which capitals were most affected?

Fuel prices have risen since the recent Middle East crisis. Gasoline and diesel consumer prices have increased significantly in many European countries on average.

However, while this was not the case in household electricity prices, natural gas prices saw moderate increases compared to fuel.

Ioannis Korras**, senior energy market analyst at VaasaETT’, told Euronews Business’: “The ongoing geopolitical tension in the Middle East’ is basically a fuel supply shock. As a result, the direct impact on European gas supply and thus retail gas prices is more pronounced compared to electricity markets.”

So how have household energy prices changed after the US-Israeli ’ joint attack on Iran’a and Tehran’'s reaction in late February? Which countries saw the highest increase in household electricity and gas prices in European capitals?

Household Energy Price Index, compiled by Energie-Control Austria, MEKH and VaasaETTAccording to the ’ (HEPI), residential end-user electricity prices averaged in EU capitals between 2 February 2026 and 1 April 2026. %It's down 3.1.

During this period, it fell from €26.13 cents per kWh to €25.31 c€/kWh’.

Highest drop %With 19, Estonia, the capital of ’, Tallinn, was seen in ’. %Copenhagen by 15.9, .2 in Stockholm and %Ljubljana followed with 15.

the Helsinki (Hilkiel,9), Riga (,6) and Madrid (.9 is also He saw declines above ’.

Korras noted that spring typically represents a transition period characterized by increased renewable energy generation and relatively moderate demand, coming after the heating season in winter and before the peak period of cooling demand in summer.

This seasonal dynamic allows markets such as Scandinavian countries and Iberia to benefit from price cuts, effectively demonstrating some degree of decoupling from fuel-induced price pressures, “ said.

There are cases when government interventions such as Spain, Great Britain and Cyprus mitigate the impact on households through financial measures, including energy tax or VAT reductions.

The biggest increase %Rome recorded with 7.9. Increase in Dublin (%5,7), Lisbon (disambiguation)%5,4) and Athens’da (%3 and 3) %It took place over 3’.

Household electricity prices have not changed or seen very small changes in many European capitals.

Korra emphasized that in markets where gas-fired production has a higher share, especially in markets where gas often sets marginal electricity prices (e.g. Italy, Ireland and Greece), there tends to be stronger increases in wholesale electricity prices, followed by end-user bills.

Changes in Gasoline Prices

Home end-user gas prices in EU capitals during this period %6.8 c€/kWh’den increased by 10.67 c€/kWh’ye increased by 11.40 c€/kWhye.

Apart from a few cities, there have been significant increases in end-user gas prices in residences. the Brussels (Brussels,8) from Berlin (.6) and Athens (,3) %It recorded an increase of over 20’.

Increase also Vienna (.9) from Amsterdam (,8) and Roma’da (,9) %Exceeded 10’.

Increases in gasoline prices Bucharest (%8,9), Riga (%8.7) from London (%8,6), from Paris (%7,9) and Tallinn’de (%7.2) was above the EU average.

In contrast, Madrid %He saw the biggest drop with 7.9, making him Ljubljana (%4) and Warsaw (%3.5) was followed.

Korras, “In April, the difference between the price movements of electricity and gas, differences in the fuel mix in European markets, and a remarkable ‘ resulting from government intervention reveal the structural dissociation of ’, ” said.

“Gas prices were mainly affected by global supply constraints and geopolitical risks, while electricity markets were also affected by local production trends and policies.”

Who pays the most for energy after the Iran crisis?

As of early April, household electricity prices vary widely between European capitals. The households of Bern (39.1 euros), Brussels (39 euros), Dublin (38.5 euros), Berlin (38.4 euros), Prague (36.3 euros) and London (35.8 euros) pay nominally the highest per kWh.

The average of EU capitals is 25.3 euros. Kiev (c€8.5), Budapest (c€9.6), Podgorica (c€11.3) and Belgrade (c€11.6) offer the cheapest electricity for households.

Paris’te is 27.2 euros and Madrid’ is 21.9 euros.

The difference in fuel prices between the capitals is also nominally remarkable. In Kiev’, it ranges from 1.6 euros to 35.8 euros in Stockholm’, while the EU average is 11.4 euros.

SwedenThe capital of ’ is followed by Amsterdam (c€20.3), Bern (c€15.7), Vienna (c€15.1), Rome (c€14.9) and Lisbon (c€14.1) at the summit.

After ’, Budapest (c€2.7), Belgrade (c€4,6) and Zagreb (c€4,6) offer the cheapest gas for residents.

In addition to Rome’ya, Paris (c€13.8) and Berlin (c€13.2) are above the EU average, while London (c€8.7) and Madrid (c€8.6) are below.

The share of taxes and delivery costs varies significantly by country, and governments may change this depending on the circumstances.

Iran war and Strait of Hormuz’ deterioration caused Wall Street’ to shift to tokenized markets 24/7

With Wall Street institutions increasingly adopting perpetual futures contracts and tokenized real-world assets to navigate the global economy 24/7, the financial world is undergoing a fundamental transformation.

According to industry experts, the elimination of contract expiration dates and the emergence of instant “atomic” settlement are redefining the market's interest, especially as crypto-native platforms continue to lead price discovery during the weekend's increasingly geopolitical crises.

The convergence of these technologies shows that the boundary between traditional finance and blockchain-based infrastructure is narrowing.

Wall Street desks, multi-strategy allocators, and macro funds are now actively exploring these digital-local structures because they solve deep-rooted operational problems inherent in standard overdue contracts.

This transition is not only a technological upgrade, but also a response to how global markets are now functioning in real time.

Theo’'s Chief Investment Officer, Iggy Ioppe, announced that the move to Euronews’e 24/7 operations is no longer optional.

To meet this new demand, Theo is developing financial products and partnering with major financial institutions such as the British multinational bank Standard Chartered.

Ioppe, “It's not a matter of preference, it's becoming a structural imperative. We saw this clearly during the closing of the Strait of Hormuz’. Traditional markets were dark during the weekend, and tokenized gold and oil were the only transparent, continuous trading venues that reflected the demand for real-time safe havens, ” said.

Speaking to Euronews’e, Andrei Grachev, Managing Partner of leading cryptocurrency market producer DWF Labs’, also emphasized the importance of these events for the wider market.

Grachev, “The clearest example was this year's February 28, ’. The United States and Israel announced Saturday morning that ’ would attack Iran, ’'s nuclear facilities, and all major exchanges (CME, NYMEX, ICE) were closed. Traders immediately moved to decentralized perpetual futures platforms for oil, gold and silver.”

When traditional venues eventually reopened, they had to capture price levels already set on the chain, highlighting a change where primary price formation took place.

An IMF report on tokenized finance released this month also highlighted that the transition to digital native assets represents a “ structural restructuring of the global financial infrastructure.

The study, written by Tobias Adrian, warns that atomic placement and programmability significantly improve capital efficiency, while also eliminating the temporal buffers that banks and regulators rely on during times when the market is stressed.

The report argues that in order for these markets to scale securely and prevent dangerous fragmentation, they must rely on ’, a public anchor of trust, especially through the implementation of Central Bank Digital Currencies (CBDC“s).

Without such sovereign payment assets, the IMF warns that the excessive speed of tokenized systems could cause liquidity crises to happen instantly, potentially leading to gradual liquidations that exceed the ability of human authorities to intervene.

Grachev, Euronews’e said: The market infrastructure that supports always-on tokenized trading still meets the demands it creates, and the difference between product capacity and operational readiness is currently one of the least appreciated risks in the field.“

What are tokenized real-world assets?

In the financial world, real-world assets, often abbreviated as RWA’s, are essentially any physical or traditional asset that exists outside the digital blockchain space.

This includes gold and other metals, real estate, oil and other commodities, as well as financial products such as government bonds and company shares.

In the context of modern markets, these assets are being “tokenized”; This means that their values and property rights are converted into a virtual token on a blockchain. It may be helpful to think of it as a digital receipt that lives in a secure and global ledger, representing a specific part or all of the asset.

BlackRock CEO Larry Fink has been one of the loudest advocates of this technological change, and in his 2026-year letter to investors, ’ stated that “tokenization can help accelerate the future by updating the installation of the financial system and making investments easier to make, trade, and access.

To support this vision, BlackRock aggressively turned to the field with the launch of the BUIDL fund, which tokenizes U.S. Treasury bonds on a public blockchain and has already reached nearly $3 billion (€2.44 billion) in assets under management.

BlackRock CEO Larry Fink, January 2026’da Davos, SwitzerlandU.S. President Donald Trump introduces ’ at the World Economic Forum in ’

What are continuous futures contracts?

A perpetual futures contract is a way to bet on the future price of an asset without actually owning it and, more importantly, without the need to compromise until a certain deadline.

In a standard futures contract, just like a lease expires, you're actually making an agreement that needs to be closed or renewed at a date set on the calendar. A “ perpetual contract completely eliminates this expiration date and allows you to keep your location forever.

When signing the contract, a “funding rate” is applied, which usually has to be paid on an hourly basis. This funding rate is positive or negative, depending on whether there are more open or short positions. If positive, long positions pay short positions, if negative, short positions pay long positions, making the ratio a balancing mechanism.

Basically, having a continuous futures contract is a way to synthetically hold the underlying asset.

The scale of this market is already quite large; The global conceptual volume for permanent futures exceeds $60 billion (€50.9 billion) per day. Especially as regulatory frameworks catch up in ABD’, the flow of corporate capital is expected to accelerate.

Fabian Dori, Chief Investment Officer of Sygnum’, a global digital asset banking group based in Switzerland, told Euronews’ that institutional adoption of “permanent assets will ultimately depend on the regulatory and custody infrastructure surrounding them, as well as liquidity and pricing conditions.

This new tool ensures that markets are always open as it allows for continuous trading even when spot markets are closed, but it also demands “atomic settlement, which means the need for transactions to be financed and concluded in real time.

In traditional finance, the T+1 or T+2 swap cycle provides a temporary buffer by dictating that the transfer of securities and related payment must be completed within the next 1-2 business days, giving market makers time to effectively source inventory and manage counterparty risk.

Atomic compromise reduces this window to zero and requires assets to be in position before or at the exact moment a trade takes place. This creates huge and sudden peak liquidity demands that must be managed through automation and advanced treasury models, while reducing the risk of counterparty stagnation.

Expert Patrick King and trader Robert Oswald, working at the New York Stock Exchange’, April 2026

Currently, the settlement of perpetual futures contracts on blockchains is done entirely with privately issued stablecoin ’s, and the IMF considers this a risk in ’'s latest report.

To solve this problem, the IMF suggested that a ’ public anchor, such as the CBDC“s, is needed to provide a secure and programmable payment asset issued by the central bank.

Beyond the agreement, the infrastructure of price data remains a critical concern. Providing liquidity 24 hours a day requires high-quality oracle’s and data streams that don't lag or stale when traditional markets close.

Ioppe, Euronews’e stated: “Price data infrastructure is probably the most critical challenge unresolved in 24/7 tokenized markets. When you consistently provide liquidity in decentralized and regulated spaces, the quality, latency, and reliability of your price flows directly determine your profit/loss and risk exposure.”

Regulated competition “ is always openAs ” enters the space, crypto-native platforms are forced to raise their standards. The implementation of the GENIUS Act ’ in the USA’ is already accelerating the trend of corporate capital moving towards areas that offer both innovation and governance.

Andrei Grachev believes that in the long run, the winners will be those who adopt these standards.

Grachev concluded his words as follows: The remaining platforms will be those that use this speed to really improve their standards, rather than going beyond regulations. As corporate allocations increase, compliance infrastructure will increasingly determine which venues attract meaningful capital and which don't.”

How are households and businesses in AB’ coping with the energy crisis?

The energy crisis caused by ’'s war in Ukraine continues to have an impact on European economies, business and consumers. Europe’'s high energy prices per year in the eurozone %It caused an inflation rate of 8.5’. ItalyCost of living in ’ %It's up 10.9.

These punitive price increases don't just hurt consumers. They also affect energy-hungry companies like the Gruppo Francia factory, which produces mozzarella on the outskirts of Roma’.

Speaking to Euronews’e Massimo Panagia, CEO of Gruppo Francia Latticini, we have 250 employees in two of our factories. “We produce 20 million kilos of cheese in different formats and specifications.”

In 2022, the CEO announced that energy bills were three times higher than in the previous year. Although investments in biogas and solar panels have managed to partially reduce these costs, they remain a heavy burden on companies like him.

Massimo Panagia, CEO of Gruppo Francia Latticini

Panagia, “In real numbers, this means an extra cost of €1.3-1.4 million, which is unpredictable. As a result, the cost of our products was significantly affected, ” added.

Are AB’'s measures to combat the energy crisis effective?

The volatility and rising prices in the global energy market have prompted the European Commission to introduce measures aimed at alleviating the burden on living-strapped EU households and companies.

The European Commission adopted the State Aid Temporary Crisis Framework in March 2022’ in order to support the EU economy following the Russian ’'s invasion of Ukraine’.

It allows Member States to provide limited assistance to companies affected by war or sanctions, provide liquidity support to businesses, and compensate for the high energy prices in which companies live.

Gruppo Francia Latticini mozzarella factory, Rome, Italy

ItalyIn ’, more than 50 billion Euro’ of state aid, including tax credits, has been approved by Brussels.

Massimo Panagia, “Given the energy bill, each company will Can calculate ’, and this ’ could use it as a loan to make up for the tax to be paid to the government in the coming months, ” said. “This mechanism unfortunately did not work well in short-term cash flow.”

This sentiment is also shared by Mauro Savoia, director of the automotive repair shop in Roma’, a family-owned business. He also took advantage of the tax credit after seeing his energy bills double within a year, but said more needs to be done to help small businesses.

Mauro Savoia, Rome, ItalyManager of a family-run automotive repair shop in ’da

Autopozzi Savoia’'s owner and managing director, Mauro Savoia, told “ that there was no financial relief at all. “We expected at least some economic assistance or grants to help companies at the end of the year.”

EuropeAssessing and rethinking ’'s energy system

UkraineThe war in ’ has revealed the need to rethink energy supply, energy consumption and energy production.

Energy expert Simone Tagliapietra, a senior member at the Bruegel think tank in Brussels, ’, said that in recent months, energy prices have been falling sharply across Europe. Families will see lower energy bills in the coming weeks and months. But those energy bills will still be twice, three times higher than what we've seen in the past, ” said.

AB’'s Temporary Crisis FrameworkDespite the benefits that ’ can bring to companies trying to survive among its exorbitant energy bills, some experts have expressed concern that this could lead to market disruption.

Tagliapietra, “In times of crisis, one of the typical reactions of the European’ is to loosen these rules of state aid a little. The problem is that when you loosen and dilute competition policies in Europe’, for example, Germany and France are usually the two largest countries that benefit the most from state aid rules; These would be Germany and France, who would have the financial space, that is, the money to spend on subsidizing their companies more than others.”

Simone Tagliapietra, senior member of the Bruegel think tank in Brussels’

“In 2022, we are faced with a situation where 80 percent of state aid is allocated only by Germany and France.’

When asked if these measures were sufficient to help businesses weather the storm Tagliapietra, “There were many interventions, that is, the tax credit was one, but then there was also a reduction in VAT’. Companies have seen their energy bills triple or even quadruple at a given time. But we need to take into account that without government intervention, energy bills would have gone up much more than that.”

The energy crisis has exposed the vulnerabilities in the European electricity market. In January, the EU launched a consultation meeting to reform the market and better protect consumers from price shocks. But Tagliapietra Euronews’e said that alone would not be enough.

We shouldn't think that this will be the solution to our energy crisis problems, ” said. What was our problem with the “Energy crisis? The mismatch between supply and demand for natural gas, namely Russia, after the arming of ’.”

The only way for “ to emerge from this crisis sustainably in the coming months is to correct this imbalance; You can do this with alternatives by reducing your demand and maximizing supply. This means building floating storage and gasification units, as Germany’ does. This means signing new gas agreements with LNG suppliers. To promote solar energy to get rid of gas in electricity generation, to promote the spread of heat pumps in our homes to get rid of gas boiler. They are the only structural solution to the energy crisis in Europe’.

Global Economies Are Trying to Stop the Rise in Inflation

While the downward trend in inflation worldwide is parallel to the economic policies of many countries, it is also noteworthy that the decline continues at different speeds in different regions.

Despite rising interest rates, sticky high inflation continues to push many governments and central banks around the world, especially in the service department.

The inflation rate, which has been low for many years, has generally entered an upward trend, especially in the recovery period after the Covid-19 pandemic.

In the aftermath of the pandemic, the economic recovery was influenced by financial incentives and the difficulties experienced on the supply side in the face of consumer demand contributed to the strengthening of inflation.

In addition to the price increases experienced in the process of reopening economies with breaks in supply chains, inflation has also been negatively affected by geopolitical developments.

With the start of the Russia-Ukraine war, the increase in inflation became even more obvious with the rapid rise in power supplies and food prices.

Disruptions in the supply chain, high oil and gas prices and the rapid rise in commodity and food prices created a full inflation storm on a global scale and significantly increased life costs.

Thus, inflation, which had been low for many years, quickly began to rise in almost all countries.

While inflation in many countries has become the biggest test of central banks after Covid-19, it has reached the highest level in the last 40 years in developed economies, including the United States and some European countries.

While some countries have relied heavily on monetary policy to curb inflation by raising interest rates, other countries have used a variety of methods for legal price controls, tax increases, and government spending reductions.

While the effort with inflation continues in many regions, it is noteworthy that some countries have been able to approach their inflation goals in the last period.

While inflation in the UK, USA, Australia and the Eurozone has fallen from peak levels to below purpose levels, hyperinflation, known as very high inflation, continues to be a problem in many African, Central and South American countries.

According to S&P Global Market Intelligence information, global consumer prices inflation decreased from a peak of 8.3 percent in September 2022 to 4.5 percent in June 2024.

THE EUROPEAN REGION

The year 2022 in the Eurozone was the peak period of inflation. The inflation rate recurred on record almost every month. The Eurozone inflation rate, which averaged 2.9 percent annually in the 2021 period, was 9.2 percent in 2022.

Annual inflation in the Eurozone, which peaked at 10.6 percent in October 2022, marked the highest level measured since the last 25 years in which information was collected by Eurostat.

Double-digit inflation numbers were experienced for the first time in most EU countries. The peak inflation was well above the European Central Bank's (ECB) 2% target.

The ECB, which strives to increase interest rates with high inflation, increased interest rates by 450 basis points in 10 consecutive meetings after July 2022.

While this has increased credit costs for consumers, it has slowed the economy by making investments in manufacturing, construction and other departments more valuable. But the bitter prescription to stop inflation has become unavoidable.

While the measures taken yielded results, the latest falling power prices and the annual inflation rate in the Eurozone in September fell to the lowest level in the last three years.

The Consumer Price Index (CPI) in the Eurozone, which was 2.2 percent in August, was 1.8 percent year-on-year in September.

Thus, for the first time in more than three years, inflation was below the objective of 2 percent, which the ECB sees as its ideal for the economy of the Eurozone in the medium term.

Energy prices fell by 1.6 percent in September compared to the previous month, while service prices fell by 1 percent. Despite this, the prices of non-powered industrial goods rose by 2.1 percent, while the prices of unprocessed food rose by 0.9 percent.

This confirms how decisive the decline in power prices is, but also slightly alleviates the concerns of relatively high inflation in the service sector.

On the other hand, information from the Eurozone has raised the expectation that the ECB will lower interest rates again at the mid-month monetary policy meeting.

The ECB, which aims for 2 percent inflation in the medium term, last went to the second interest rate reduction of the year on September 12 in line with market expectations, reducing the deposit interest rate by 25 basis points, the main refinancing interest rate and the marginal borrowing interest by 60 ⁇ ar basis points.

The bank reduced the deposit rate, which is very valuable for financial markets, by a quarter of a point to 3.50 percent.

While the ECB Board of Directors has previously confirmed that it will not adhere to a certain interest rate pathway, some analysts predict that the bank will continue to reduce interest rates until mid-2025.

The LAGARDE is: ECB monitors fall in inflation with optimism

ECB President Christine Lagarde, speaking this week about the policies they will implement, ⁇ Recent developments strengthen our confidence that inflation will return to its purpose in time. We will take this into account in our monetary policy meeting in October.

Pointing out that the decline in inflation has accelerated in the last two months, Lagarde said that headline inflation fell to 2.2 percent in August 2024, and that inflation is expected to decline further in September due to decreasing power costs.

Lagarde pointed out that the impact of the sharp declines in power prices on annual inflation has disappeared, so inflation may increase by a measure in the fourth quarter.

Pointing out that they are determined to ensure that inflation returns to its 2 percent goals on time in the medium term, Lagarde said that they will continue to follow a data-based approach to determine the appropriate level and duration of restrictions, focusing on the inflation outlook, the dynamics of inflation and the transmission power of monetary policy.

Lagarde ⁇ 's statements have sufficiently raised expectations in financial markets that the ECB ⁇ may reduce interest rates again.

INFLATION IN GERMANY DISCOVERED UNDER THE PURPOSE OF ECB ⁇

According to the German Federal Statistical Office (Destatis), annual inflation in Germany fell to 1.6 percent in September due to tight interest rate policy and uncertainty in economics, well below the ECB's goal.

Thus, annual inflation in Germany, the dominant economy of AB ⁇ , fell to its lowest level since January 2021 ⁇ .

EU-compliant CPI fell by 0.1 percent in September compared to the previous month and rose by 1.8 percent year-on-year. EU-compliant CPI was recorded as 2 percent annually in August.

Core inflation, which is calculated by excluding food and power in the country, decreased from 2.8 percent to 2.7 percent in September.

In this case, the prices of food products, which were the biggest determinants of inflation in the country last year, increased by 1.6 percent compared to a year ago in September, while power products decreased by 7.6 percent.

ABD ⁇ DE INFLATION IS THE LOWEST LEVEL SINCE FEBRUARY 2021

According to U.S. Department of Labor data, the Consumer Price Index (CPI) in the country increased by 0.2 percent on a monthly basis in August and 2.5 percent on a yearly basis in line with expectations.

Annual inflation in the U.S. reached its peak of 41 years with 9.1 percent in June 2022. High inflation was the biggest concern of voters in the 2022 midterm elections.

CPI, which recorded its lowest annual increase since February 2021, increased by 2.9% year-on-year in July.

The core CPI, which does not include variable power and nutrient prices, also increased by 0.3 percent monthly and 3.2 percent year-on-year in August.

ENGLAND (UK) - Mm-hmm.

Annual inflation in the UK has fallen significantly since reaching a 40-year high of 11.1 percent in October 2022.

According to data from the British Office for National Statistics (ONS), annual inflation in the country was expected to be 2.2 percent in August. Inflation was 2.2% in July.

Annual inflation, excluding energy and food prices, was 3.6 percent in August. In July, core inflation was measured at 3.3 percent year-on-year.

Service sector inflation was calculated as 5.6 percent year-on-year in August. Service inflation was 5.2 percent in July.

The decline in the inflation rate in countries does not indicate that prices are falling, but only that prices are rising at a lower rate.

AUSTRALIA AND SOUTH KOREA

Annual inflation in Australia, one of the developed countries, fell to 2.7 percent in August from 3.5 percent in July, entering the target range of the country's central bank.

This decrease reduced the inflation rate to the target range of 2-3 percent of the Reserve Bank of Australia for the first time since August 2021.

In Canada, the annual inflation rate fell more rapidly than expected in August, from 2.5 percent to 2 percent. This is the lowest inflation rate in the country since February 2021.

Inflation in South Korea reached its lowest level in three and a half years at 1.6 percent in September. This decrease compared to the 2 percent increase in August reflected the ongoing efforts to stabilize the economy in the face of fluctuations in global conditions. Inflation in South Korea was recorded as 6.3 percent in July 2022. The South Korean Ministry of Finance expects annual inflation to be 2.6 percent this year.

Annual inflation in Brazil, which has the largest economy in Latin America, decreased to 4.24 percent in August 2024 after rising to 12.13 percent in April 2022.

In India, the inflation rate, which was 7.79 percent in April 2022, decreased to 3.65 percent in August 2024 and fell to the second lowest level in the last five years.

Global food prices rise highest in 18 months in September

the United Nations Food and Agriculture Organization (FAOFAO) announced the September results of the Global Nutrient Price Index, which tracks the monthly change in the prices of food products between countries.

Accordingly, the FAO Food Price Index rose 3 percent on a monthly basis and 2.1 percent on a yearly basis in September to an average of 124.4 points. Thus, global food prices have seen the fastest increase in the last 18 months, led by sugar prices. In September, the Sugar Price Index recorded the largest monthly increase of 10.4%.

Weakening revenue expectations in Brazil and concerns that India's decision to lift restrictions on the use of sugarcane for ethanol production could affect the country's exports have been instrumental in this increase.

The increase in all works attracted attention

The Grain Price Index rose 3% on a monthly basis in September. This increase was due to the rise in wheat and corn export prices.

Vegetable Oil Price Index up 4.6% month-on-month, Prices of palm, soybean, sunflower and canola oil increased. The increase in international palm oil was due to the lower-than-expected production of the main producing countries in Southeast Asia.

The Milk Price Index increased by 3.8 percent on a monthly basis in September, while the Meat Price Index increased by 0.4 percent.

The increase in meat prices was due to the rise in chicken meat prices due to the strong demand for Brazil's works.

FAO revised its global grain production forecast for this year to 2,853 million tons, while forecasting that wheat production will increase by 0.5 percent this year compared to last year.

Is this the most affordable country to buy a house in Europe?

According to a new report from BestBrokers ⁇ , Denmark is the most affordable country to buy a house in Europe according to the average income.

According to the findings of BestBrokers ⁇ , the IMF, real estate price expert Numbeo and TradingEconomics ⁇ in data, the average price of a 100-square-meter property corresponds to a net salary of 114 in Denmark ⁇ , ranking the Northern country as the most affordable country to buy a house in Europe ⁇ . .

Meanwhile, Denmark became the most expensive country in the EU in 2023 ⁇ (prices for goods and services according to Eurostat ⁇ %It was over 43) and the annual average earnings was the seventh highest in Europe.

Related to
  • Europe's best and worst real estate markets: Where to invest in 2024?
  • Where are the biggest tax havens in Europe and how do they attract the rich?

In the report, ⁇ As prices and incomes differ significantly from one country to another, the BestBrokers team decided to examine the real estate market based on how many months of salary is required to buy a house in various European countries. ⁇

The affordable price ranking is based on data that examines ⁇ real ⁇ mortgage interest rates, which are housing loan interest rates adjusted for housing prices, average net monthly income, inflation and inflation across 62 countries in the world.

Where in Europe does it take the longest to save money to buy a house?

According to this report, Ireland and Sweden are the second and third most affordable countries in Europe, capable of buying a 100-square-meter house with a net salary of 123 and 129, respectively. That's about a 10-year annual salary.

But there's one small problem, and that's that the census is purely theoretical. This means that spending on food, housing, childcare, or anything a person might need or want doesn't count.

In Europe, the Czech Republic and Slovakia are in the last place. In the latter, the average cost of a house of 100 square meters is 297 times the average salary that can be earned in almost 25 years. If someone can save half of their net salary, they'll still be thinking about the 50 years they've spent saving heavily to own a family home.

Real mortgage interest rates for the third quarter of 2024 in Europe

One of the most important data to analyze home prices and affordability was the counting of real mortgages in each country. The study used data on mortgage rates and projected inflation rates for the third quarter of 2024 to learn about the ⁇ real ⁇ mortgage rates for the third quarter of 2024 in various countries.

The report says that the actual mortgage interest rate reflects the actual cost of funds for the borrower and the actual return for the lender.

According to the report, the highest real mortgage interest rate is in Russia, where the state-sponsored mortgage program ended in July 2024.

According to the report, the nominal mortgage rate for the third quarter of 2024 %It's expected to be around 20.3. Do this for me %They adjusted it with projected inflation of 8 ⁇ , which means that the real mortgage rate is 2024 ⁇ te %He predicted it would be at 12.3. July-September 2024 period.

According to this calculation, real mortgage rates are high among other European countries. %6.65 in Latvia and %Poland is 5.1. In Germany it is 1.85% and in England it is 1.77%. the French (France%1,13), from Italy (%0.99) and the Netherlands (%0.96) in Europe's next largest economies. %It is around 1.

For example, in Belgium (-%0.52) and in Sweden (-%1.21) Negative real mortgage rates: ⁇ Do not suggest that there home buyers will eventually not pay interest on their mortgages; instead of borrowing the actual (nominal) cost may have fallen ⁇ he read the study.

How much does a 100-square-meter house cost per month around the world?

The country in the world where it is most convenient to buy a house according to the fees is South Africa, where people need 71 times the average fee to own a property of 100 square meters.

The United States ranked second in this ranking. However, property prices vary greatly from state to state. The report found that people in the U.S. need an average wage of 76 months to buy a home. This is equivalent to about six years of annual salary.

At the bottom of the ranking is Nepal, with 684 salaries required to buy a house. He is followed by Turkey with 631 people.Equivalent to 52.5 years of earnings.

Disclaimer of Disclaimer: This information does not constitute financial advice; Always do your own research to make sure it suits your specific circumstances. Also remember, we are a journalism site and aim to provide the best guides, tips and advice from experts. If you trust the information on this page, you do so at your own risk.

Red Sea Crisis Increases Sea Route Prices

The US recently towed the aircraft carrier USS Dwight D. Eisenhower from the Red Sea and sent the USS Theodore Roosevelt and its escort ships in its place. The primary mission of the American fleet here is to protect maritime shipping routes from the Arabian Peninsula to the Suez Canal.

This news didn't make the headlines and didn't attract much public attention. But the sea route passing through the Red Sea is very important for world trade.

Houthi militias have been firing on ships coming from Yemen for more than six months that they associate with Israel because of their owners or operators.

Bloomberg news agency reported on June 20 that the Houthis, who are in favor of Palestine in the Gaza crisis, sank a cargo ship carrying coal using a UCAV.

In response to the Houthis' attacks, the United States and Britain have repeatedly hit militia positions in Yemen in recent months. In addition, other warships belonging to the international coalition are trying to secure shipping traffic off the Yemeni coast. The German navy also appears in the region with the ⁇ Hessen ⁇ frigate within the scope of AB ⁇ 's ⁇ Aspides ⁇ mission.


The frigate ⁇ Hessen ⁇ of the German Navy was also deployed in the Red SeaPhoto: Bernhard Herrmann and IMAGO

Costs are rising again

Since the beginning of the conflict in Gaza in October last year, global trade has been under great pressure. Traders around the world have to spend more money to account for higher shipping costs and insure their goods.

Shipowners also complain about high insurance costs as the risk of losing their ships increases significantly. Ships that avoid passing through the Suez Canal and instead travel around the Cape of Good Hope are forced to take into account longer journey times and higher fuel costs.

⁇ Drewry World Container Index ⁇ monitors the freight market and records exorbitant price increases. The price to be paid for transportation activities carried out by sea, land, air or railway is called ⁇ navlun ⁇ . According to the index, the average freight price for a large standard container of 40 feet ⁇ increased by seven percent in June, compared to the previous year, an enormous increase of 233 percent. On some routes, prices have risen even more sharply.

Indirect effects of what happened in the Red Sea

Simon MacAdam, an economist at London-based independent financial consulting firm Capitol Economics, comments on DW ⁇ ye:

It should not be forgotten that direct armed conflicts are not responsible for the current price increases. The real trigger for the cost seems to be that importers are pushing many orders forward to ensure they have enough goods in stock throughout the year. In addition, factors such as the fact that ships have to go around the Cape of Good Hope put great pressure on shipping and cause prices to increase even more.

The route around the Cape of Good Hope in South Africa means that ships must fully circumnavigate the African continent before reaching Europe.


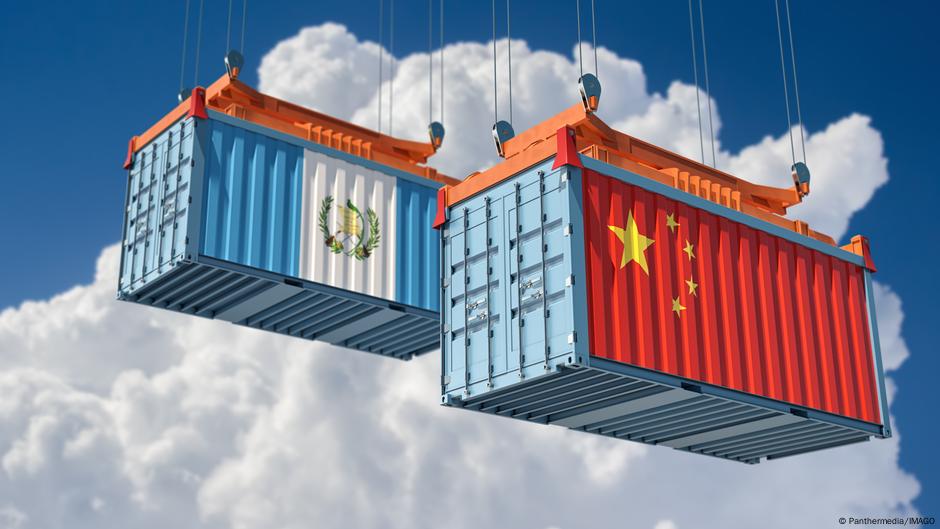
Container and shipping prices have increased significantlyPhoto: Panthermedia and IMAGO

We need more ships.

Jan Hoffmann, a trade expert at the World Conference on Trade and Development (UNCTAD), a Geneva-based UN agency, explains why DW ⁇ ye freight prices are generally rising:

The main reason for this is the extension of the distances that ships have to travel. Deviations around South Africa require more ships to maintain supply. The average distance for a container will be nine percent longer in 2024 compared to 2022.

Hoffmann continues his words as follows:

If ships are to travel longer, more transport capacity will have to be used. This means buying or renting more ships and employing more staff. Longer routes require more ships. If these ships are not yet available, freight prices will rise even higher. ⁇

The environment is also suffering from this situation, according to the UNCTAD expert:

Another effect is that ships increase their speed. Higher speeds to cover longer distances, for example, led to a 70 percent increase in emissions on the Singapore-Rotterdam route.

According to Hoffmann ⁇ , if the deviations continue for a longer time, this will lead to continued price increases and further restrictions on international trade.


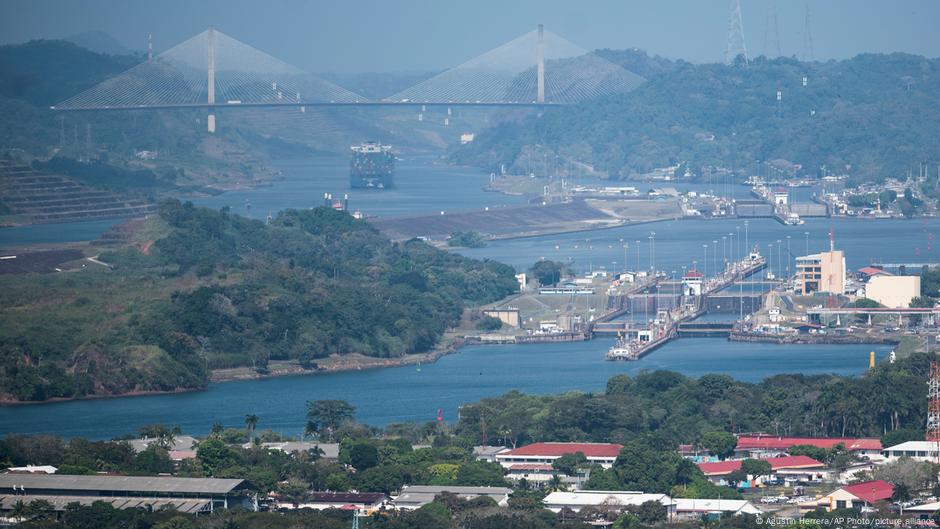
The water level in the Panama Canal is higher than in the previous yearPhoto: Agustin Herrera/AP Photo/picture alliance

There's a double bottleneck

The maritime bottleneck also prevents goods from being transported elsewhere, Hoffmann stresses:

Due to the inadequacy of the water level in the Panama Canal, navigation is not possible without restrictions. Since both the Suez and Panama canals cannot be used at full capacity, the USA needs to build a land bridge to maritime connections with East Asia. In other words, land transportation should be carried out by rail or road from the ports on the west coast to the centers on the east coast. ⁇

But it doesn't seem that easy. This method is also considered economically inefficient, especially when it comes to the shipment of wheat or liquid gas. For this reason, like the alternative route around Cape Horn, the southernmost tip of South America, a very long and dangerous deviation is preferred.


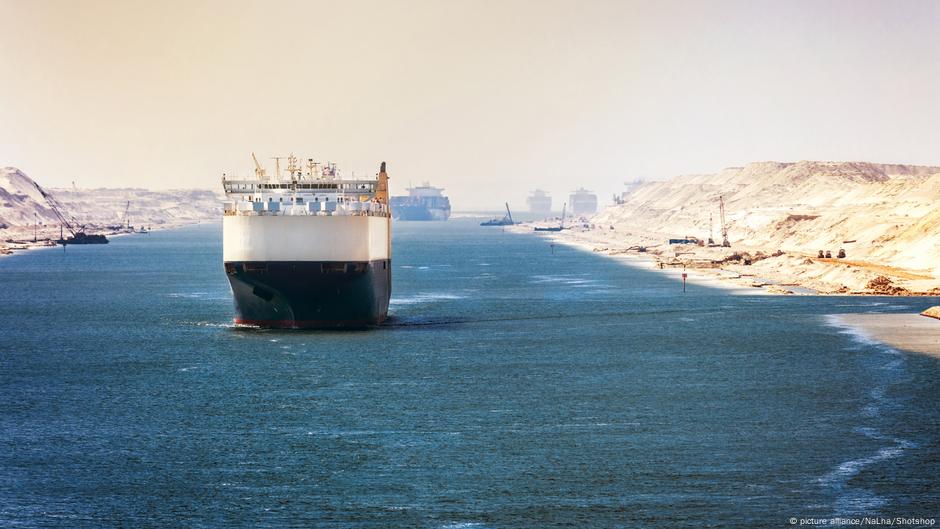
The Suez Canal is of great importance for world tradePhoto: picture alliance/NaLha/Shotshop

⁇ The situation can get worse ⁇

The situation in the Red Sea remains tense. According to Bloomberg, about 70 percent of international maritime transporters still avoid the area and instead choose to travel around the Cape of Good Hope in South Africa.

The deployment of the US Navy's new aircraft carrier fleet also shows how serious the situation in the region is in the long run by the military.

Economist Simon MacAdam believes that a prolonged crisis will push shipowners too far and cause freight prices to rise even higher:

It takes many years to build the ship and 90 percent of the new containers are built in China. Therefore, ships and containers cannot be built overnight for higher capacities. Therefore, the situation may get worse in the long run.

National Vehicle Recognition System prices announced

National Vehicle Recognition System (UTTS) Vehicle Owner Taxpayer 2024 Unit Price List has been announced by the General Directorate of Mint and Stamp Printing.

Vehicle Recognition Unit (TTB) price was determined as 1,810 TL (excluding VAT) for 1 unit. This price will include the assembly service fee that vehicle owners will make to authorized companies.

Turpak Deputy General Manager for Sales and Marketing Alper Önkol, ⁇ With the strong infrastructure and knowledge of 25 years, we have completed all our preparations with 200 fixed and 50 mobile teams in 81 provinces to offer National Vehicle Recognition Systems (UTTS) assembly, service and call center services throughout Turkey ⁇ said.

The National Vehicle Recognition System (UTTS) unit prices for 2024 have been determined. According to the statement, the price of the Vehicle Recognition Unit (TTB) was determined as 1,810 TL (excluding VAT) for 1 unit.

Payments, including the cost of the assembly service to be performed by authorized companies, can be made to the bank account specified on www.utts.gov.tr, the official website of the General Directorate of Mint and Stamp Printing.

These unit prices, which are special for 2024, will be increased by the Domestic Producer Price Index (D-PPI) announced by the Turkish Statistical Institute in 2025 and later, and the new prices will enter into force at the beginning of each year.

TÜSMOD Production and Service Purchasing Inflation, compared to the previous month in July %It increased by 1.58.

Foreks ⁇ TÜSMOD Production and Service Purchase Inflation July 2024 results were announced.

Accordingly, TÜSMOD Production and Service Purchasing Inflation in July compared to the previous month %1.58 increase compared to December of the previous year .68 increase and compared to the same month of the previous year %It increased by 36.63.

Category-by-category, highest purchasing inflation in July %With 6.08, Freight prices are seen, while the lowest purchasing inflation is %It was seen in food prices with a decrease of 2.17.

TÜSMOD General Price Index was 658.77 in July 2024 compared to the previous month %1.58, compared to December of the previous year. .68 increase and compared to the same month of the previous year %It increased by 36.63.

TÜSMOD Metal Price Index was 267.03 in July 2024 compared to the previous month %1.50 decrease compared to December of the previous year. %4.46 increase compared to the same month of the previous year %It increased by 15.22. 

TÜSMOD Plastic Price Index was 87.59 in July 2024 compared to the previous month creased by 0.14, compared to December of the previous year %4.13 increase and compared to the same month of the previous year %It increased by 2.15. 

TÜSMOD Energy Price Index in July 2024 as 1014.92 compared to the previous month %2.52, compared to December of the previous year. %9.67 increase compared to the same month of the previous year %It increased by 24.15. 

TÜSMOD Food Price Index was 469.83 in July 2024 compared to the previous month %2.17, compared to December of the previous year. .53 increase and compared to the same month of the previous year %It increased by 37.88. 

TÜSMOD Service Price Index was 1453.86 in July 2024 compared to the previous month %2.90, compared to December of the previous year. .37 increase and compared to the same month of the previous year %It increased by 55.59.

TÜSMOD Freight Price Index was 217.80 in July 2024 compared to the previous month %6.08, compared to December of the previous year. .85 increase compared to the same month of the previous year .31 is up.

Highest increase in the Metal Price Index %4.17 is seen in Flat Round Steel, while the highest drop is seen in %He was seen in Kalay ⁇ with 13.87. Do this for me %Aluminum with a drop of 13.04 and %Zinc followed with a decline of 11.96.

Highest increase in the Plastic Price Index %At 0.74, the highest drop was seen in PA prices. %Seen in HIPS ⁇ with 1.59. Do this for me %PVC followed with a 0.34 decrease.

Highest increase in the Energy Price Index .28 as seen in the Domestic LNG ⁇ , this %Domestic LPG with 8.65 and %6.85 followed by Coke Coal. The highest fall %Global with 21.38 the Natural GasWhen you see this %With a 6.26 Brent Oil was watching.

Red Meat in Food Price Index %4.75 and White Meat %3.32 is down. Fruit and Vegetable group, respectively %0.19 and %It showed 0.50 rts. The highest increase in the food group %While it is seen in Vegetable with 0.50, the highest decrease is .55 was seen in Global Rice.

Highest increase in the Service Price Index .94 as seen in Container Shipping. %6:45 p.m. and %Insurance followed with 5.53. The commodity whose price fell the most in July in the service group %It was Air Cargo Shipping with 0.20.

Domestic Shipping in Freight Price Index %5.33 increase, while Air Cargo Shipping %0.20 drop and Container Shipping %It increased by 17.94.

TÜSMOD Commodity Price Index is created by using World stock market prices, TÜIK data, Market prices and measures the change in purchasing prices of companies. It has been published every 3rd week of the month since January 2013. 

TÜSMOD Commodity Price Index is based on 31 December 2012 prices as 100.